When I work with clients, one of the key things they want to understand is how they track community growth and react to the data they are seeing. This can be a complex business: community platforms provide bazillions of metrics. Which ones should you track? Or, should you track them all?
Definitely don’t track everything. That is a fast-track to driving yourself bonkers.
Much to the chagrin of metrics nerds, tracking too many things can be a distraction. A better approach is to decide on a key set of dimensions and track those things effectively. Focus less on the number of graphs and more what you want to learn from the data.
Today I want to recommend what some of these metrics should be. For the purpose of this article, I am using Discourse as an example; they are a platform I commonly I use with clients.
The graphs you will see below are from a client of mine who are running a fairly specialist niche technical community that pre-launched late last year (who gave me permission to anonymously share the graphs). This are early stages for the community, but I think they are making great traction and these these graphs are illustrative of what you might want to measure and how you evaluate the data.
#1. Consolidated Page Views
The first thing you should track is general activity. How many people are coming to your forum, and what kind of traffic are you seeing?
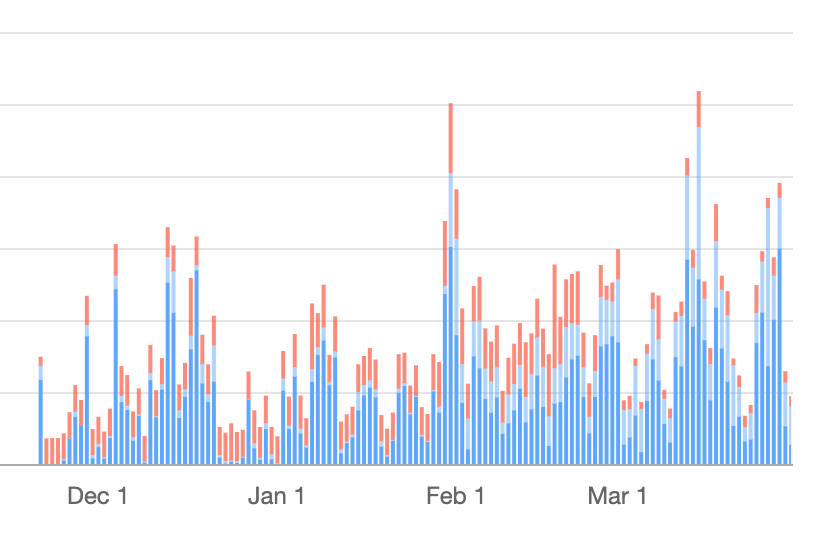
In Discourse, Consolidated Page Views are helpful here. It shows the breakdown between logged in members (dark blue), anonymous non-logged-in users (light blue), and crawlers (red).
Most community members are window shoppers at first. They start browsing a forum (often to find answers to their questions or researching a product before they use it) before ever signing up. Your forum will likely crop up when they search for this information on Google.
As such, you want to track general traffic to the forum (to see how much utility the forum provides more generally), as well as track logged-in users to determine if your contributor base is regularly showing up.
If your general traffic is flatlining, you need to raise better awareness of your community: integrate it into your website, promote it on social media, mention it in content, etc.
#2. Signups
In the early stages of a community the most critical thing is to ensure that every member has a great experience. Don’t worry too much about growth: focus on delivering a great community experience. We will discuss this a little later.
It is though important to track sign-ups as they give us a good sense of people coming into the community:
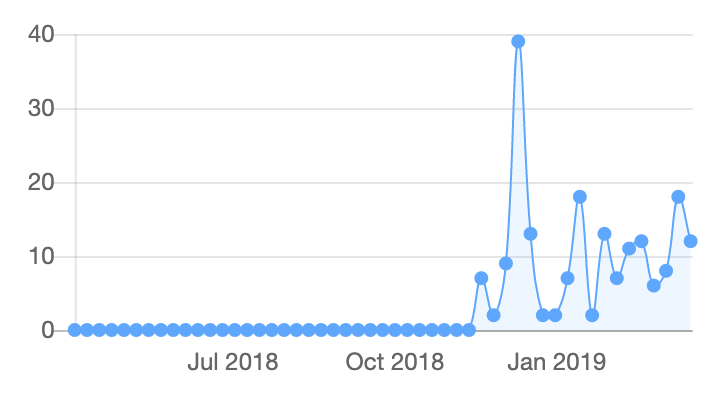
As a general rule, you want to see this at least consistent, but preferably growing. Bear in mind that sign-ups do not exist in a vacuum: people need a reason to sign up, otherwise they will just browse anonymously.
As such, brainstorm how you incentivize people to join. How are you pulling them in? How are you engaging and rewarding them? Try new ways of incentivizing people and track your impact with the above graph: if you see spikes, you know you are doing something right.
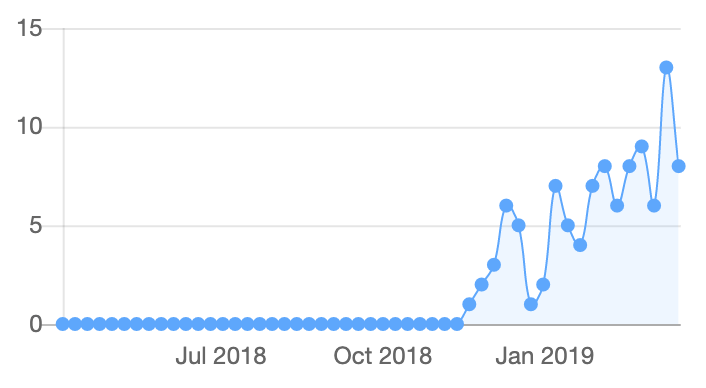
#3. Posts
While we are on the subject of tracking activity, a useful metric to track how much people are posting. While least critical, it gives us a general sense of the growth (or lack thereof) of discussion:
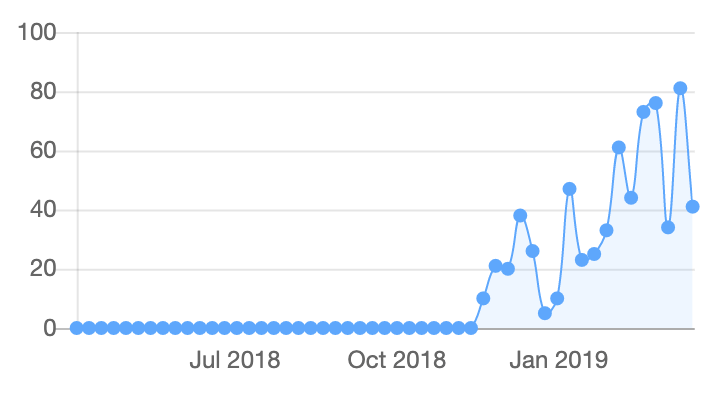
Just like the stock market, this is a graph that can be spiky depending on a given week or month, so don’t take it too literally.
What you want to look for is a general community growth pattern in discussion. If you have lots of people registering signing-up and logging in (our previous two graphs) but your posts are flatlined, your forum is simply not interesting/engaging enough. If you have a growth in posts and flatlined member sign-ups, it means you have a very engaging forum that no-one knows about or where many people struggle to find a way to participate.
#4. DAU/MAU
One of the hardest but most critical metrics to track is member “stickiness”. That is, how many of your members are sticking around, participating, and actively engaging. We don’t just want lots of members, we want them having an awesome experience.
The most critical metric here is the Daily Active Users/Monthly Active Users graph:
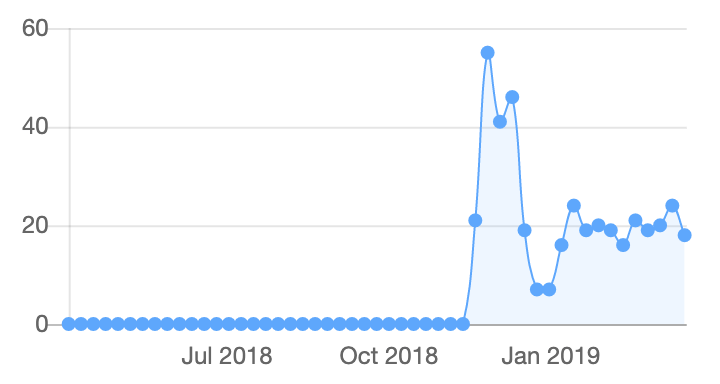
The formula here is simple: the graph presents a percentage score calculated by the number of members that logged in in the last day divided by the number of members that logged in in the last month. It gives us a good sense of overall repeated engagement and as a general rule, you want to shoot for over 30% stickiness.
As you can see in the above example, we had a bump around initial pre-launch, and then the engagement has flattened and is growing gradually. This is a pretty common pattern.
Our goal is to get this consistently up above 30% (which requires a combination of a diverse range of discussions to pull people in, constant encouragement of member participation, incentivizing and rewarding great contributions, and always adding more and more value for members to justify their time and participation.)
A common tool to get this figure up is rewarding active contributors. Just remember the The Risks Of Over-Rewarding Communities.
#5. Daily Engaged Users
While DAU/MAU is useful, it also fights crime with the the Daily Engaged Users graph, which is the number of members who have liked or posted in the last day:
This gives us a useful community growth curve for general member engagement. For a small early-stage community like this, the above graph is where I want to see it: consistent growth.
This graph is useful for determining the general growth curve for overall engagement. If you see this graph flattening out, it typically means there is not enough value for members (or a nervousness to engage.)
#6. Trust Level Growth
Finally, Discourse has the concept of Trust Levels. This is a powerful way to score members based on their active participation. It provides a great way to see which members are most active and then be able to reach out and engage with them. For example, with many communities I work on, we will work with the higher trust level members to provide mentoring and training.
This is enormously powerful. In this community I am referencing in this post, we have 92 people in Trust Level 0 (which means they haven’t done very much), 92 people in Trust Level 1, and 11 people in Trust Level 2. I am working with the client to start working with those 11 people in Trust Level 2 to engage as much as possible, give them additional opportunities and responsibilities, and make them feel part of the team.
The answers to how we build great communities live in the heads of your members. Identifying these people via trust levels is a great way to build real community and team spirit.
If you found this interesting, you may also want to check out my video on Measuring Community Health and The Importance of Validation and Decay In Community Reputation Metrics.
Of course, these graphs are just scratching the surface, but they are a place to get started. What other metrics do you track? What am I missing out here? Let me know in the comments….